Note
Access to this page requires authorization. You can try signing in or changing directories.
Access to this page requires authorization. You can try changing directories.
Use the Quick source tool to display or edit source files at the same time as displaying a tool other than the Sources tool. The Quick source tool always displays the same files that are open in the Sources tool.

The main place to view source files in the DevTools is within the Sources tool. But sometimes you need to access other tools, such as Elements or Console, while viewing or editing your source files. Use the Quick source tool, which by default opens in the Quick View panel at the bottom of DevTools.
Use the Quick source tool in conjunction with the Sources tool
To display the Quick source tool in Quick View at the bottom of DevTools, a tool other than the Sources tool must be open in the Activity Bar at the top of DevTools.
The Quick source tool provides an alternative display of the files that are open in the Sources tool. The Quick source tool has a subset of features. For full features, use the Sources tool.
If you open or close a file in one tool, the file is opened or closed in the other tool. In both tools, there's a tab for each open file.
Edit local source files in DevTools by selecting a Workspace folder
This is an end-to-end tutorial of all steps to demonstrate the Quick source tool, by using the ToDo web app in the MicrosoftEdge / Demos repo.
By selecting a local folder as a Workspace in the Sources tool, you can then edit files from within the Quick source tool at the same time as displaying a different tool, and have those edits be saved to your local drive. This way, you can edit files in the Quick source tool while using another tool, such as Elements or Network, and have your edits be saved to the corresponding source file on your local drive.
To edit source files in the Quick source tool, you'll do the following:
Have access to the webpage source files locally, such as a cloned repo.
In the Workspace tab in the Sources (
 ) tool, add a local folder of source files.
In the Workspace tab, open a file, such as a
.jsfile.In the Activity Bar, select a tool other than the Sources tool, such as the Elements tool.
In the Quick View panel at the bottom of DevTools, open the Quick source tool. The opened
.jsfile is shown in a streamlined editor, and the Elements tool is still displayed.
These steps are detailed in the tutorial below.
Have local source files, such as a cloned repo
To use the Quick source tool to save changes locally, you must have local source files that match the web server files. Make sure there are source files on your local drive, that match the transient files that are returned by the web server.
For example, if not done already, clone the MicrosoftEdge / Demos repo to your local drive, as follows:
If not done already, Download git and install it.
If not done already, install an up-to-date version of Node.js and npm from Node.js.
Go to MicrosoftEdge / Demos in a new window or tab.
Click the Code drop-down button.
Click the Copy url to clipboard button.

The URL is copied to the clipboard:
https://github.com/MicrosoftEdge/Demos.gitOr, if you have GitHub Desktop installed, click Open with GitHub Desktop to clone the repo, and skip the command prompt step below.
Or, you can use Visual Studio Code's Source Control pane to clone the repo, and skip the command prompt step below.
Assuming you have git installed, open a command prompt.
Clone the repo to your local drive, entering the URL string that you copied from the GitHub repo. If you use a command prompt:
# example location where the repo directory will be added:
cd ~/GitHub
git clone https://github.com/MicrosoftEdge/Demos.git
For details about cloning a repo, see:
- Clone the Edge Demos repo to your drive in Sample code for DevTools.
- Clone the WebView2Samples repo in Set up your Dev environment for WebView2. Shows a different sample repo, but shows steps for several tools.
- Cloning a repository - GitHub docs.
Now you have a local folder of source files (such as /demo-to-do/) that match the files on the web server.
Continue with the next section.
Start a localhost server
Go to a command prompt, such as the git bash shell, or the Terminal pane in Microsoft Visual Studio Code.
Go to the cloned
/demo-to-do/directory, such asC:\Users\localAccount\GitHub\Demos\demo-to-do\.If you use the git bash shell, it's a UNIX shell, so even on Windows, you need to wrap a directory path that has backslashes in quotes, or else use forward slashes rather than backslashes.
Create a working branch named "test" and switch to it (to avoid altering the demo's files in the "main" branch):
git checkout -b testThat's equivalent to:
git branch test
git switch test
Run one of the following commands, to start the web server:
# Node.js option
cd ~/GitHub/demos/demo-to-do
npx http-server  # Node.js
For more information and options, see Start the server (npx http-server) in Installing the DevTools extension for Visual Studio Code.
# Python 2 option
cd ~/GitHub/demos/demo-to-do
python -m SimpleHTTPServer  # Python 2
# Python 3 option cd ~/GitHub/demos/demo-to-do python -m http.server # Python 3Open a tab in Microsoft Edge, and go to the locally hosted version of the site. You should be able to access it by using
localhost:8080:
Another common equivalent URL is
http://0.0.0.0:8080. The default port number for the Python server option is8000. The exact port number might be different.The DevTools Workspaces Demo webpage opens.
See also:
- Running a simple local HTTP server in How do you set up a local testing server? at MDN - shows Python.
Continue with the next section.
Select a local folder of source files as the Workspace
Continuing from above, right-click the demo webpage and then select Inspect.
DevTools opens.
In the Activity Bar at the top of DevTools, select the Sources (
) tool, select the Workspace tab (grouped with the Page tab), and then in the Workspace tab, click the Add folder button.The Select Folder dialog opens.
Navigate to a folder, such as
C:\Users\localAccount\GitHub\Demos\demo-to-do, and then click the Select Folder button.At the top of DevTools, a message reads DevTools requests full access to <path>.
Click the Allow button.
The tree of
demo-to-dofiles appears in the Workspace tab of the Sources tool. The HTML, JS, and CSS files have a green "mapped" dot.In the Workspace tab, expand the file tree, and then click one or more files, such as
to-do.js.The file opens in the Sources tool:

Open the Quick source tool and edit a file
Suppose you want to continue viewing the Elements tool, but you want to simultaneously view and edit the source files that were opened via the Sources tool.
Continuing from above, in the Activity Bar at the top of DevTools, select a tool other than the Sources (
) tool, such as the Elements ( ) tool.
If the Quick View toolbar isn't shown at the bottom of DevTools, press Esc.
In the Quick View toolbar at the bottom of DevTools, click the More tools button, and then select Quick source.
The Quick source tool opens in Quick View at the bottom of DevTools:
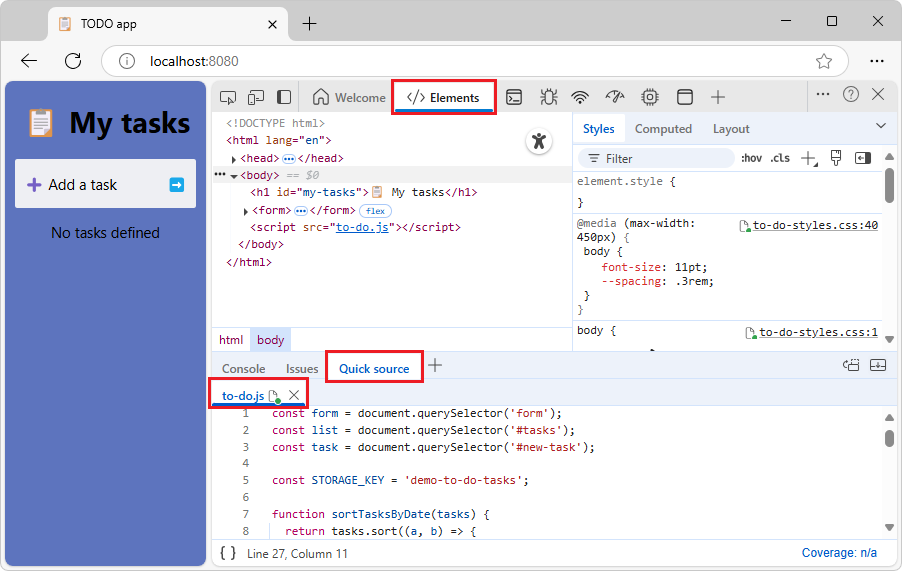
todo.jsis displayed, because that file is open in the Sources tool.In the demo To Do webpage, delete any tasks.
Click the Quick source panel, and then press Ctrl+F.
In the Quick source tool, the Find UI appears.
Enter no tasks, and then press Enter.
In the line of code, change
no tasksto0 tasks.An asterisk appears on the file name tab.
Press Ctrl+S.
The asterisk is removed from the file name tab.
Refresh the demo webpage (Ctrl+R).
If the rendered webpage doesn't change from "No" to "0", and there's no longer a green "mapped" dot on the JS file name tab, long-click or right-click the Refresh button in Microsoft Edge, and then select Hard refresh (Ctrl+Shift+R).
The rendered webpage changes from "No" to "0", and there's a green "mapped" dot on the JS file name tab.

Now, when you edit the folder's files in DevTools, the edits are not only made to the transient file that's returned by the server, but are also saved to the source files on your local drive. You can edit the file from within the Quick source tool at the same time as displaying another tool (or from within the Sources tool).
This is the end of the tutorial steps.
See also:
- Add a local folder to the workspace, to use DevTools to edit files and save changes to disk in Sources tool overview.
- Edit and save files in a workspace (Sources tool Workspace tab)
- Step 6: Save a JavaScript change to disk in Workspace tutorial (Sources tool Workspace tab)
Open a file by using the Command Menu
Opening a file by using the Command Menu opens that file in both the Quick source tool and Sources tool.
To open the Command Menu, do any of the following:
Select Customize and control DevTools > Run command.
Press Ctrl+Shift+P (Windows, Linux) or Command+Shift+P (macOS).
Click the Run command link in the empty Quick source tool (or Sources tool).
To open a file by using the Open File prompt of the Command Menu, do any of the following:
Select Sources tool > More options (next to the Page tab) > Open file.
Select Customize and control DevTools > Open file.
Press Ctrl+P (Windows, Linux) or Command+P (macOS).
When the Quick source tool (or Sources tool) is empty, click the Open file link in the instructions in the tool:
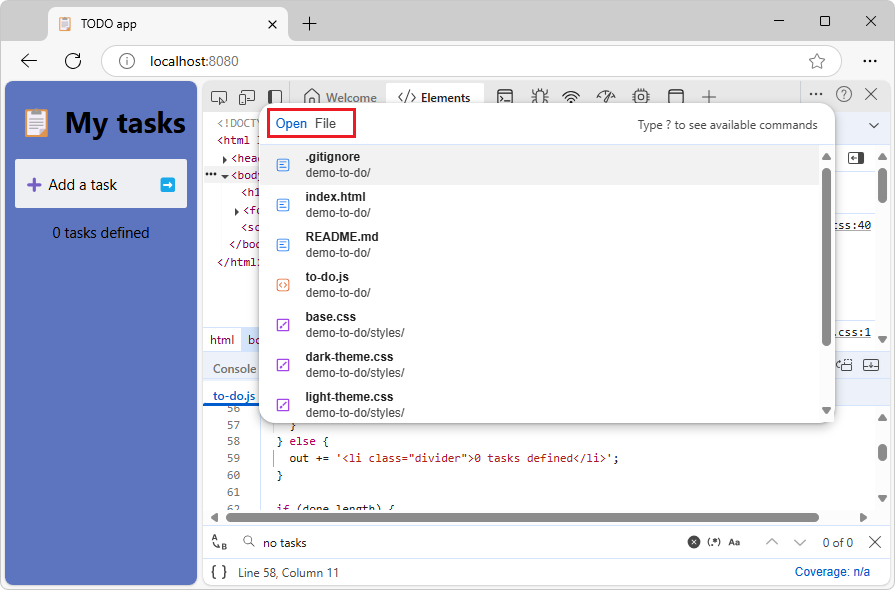
The Open File prompt of the Command Menu is displayed.
To display the Open file link in the instructions in the panel, you might need to scroll down, or drag the Quick View divider up to make the Quick View panel taller.
Keyboard shortcuts in the Quick source tool
The Quick source tool has a streamlined UI. Use these keyboard shortcuts.
Ctrl+F - Find.
Ctrl+S - Save. If there's no longer a green "mapped" dot on the HTML, JS, or CSS file name, long-click or right-click the Refresh button in Microsoft Edge, and then select Hard refresh (Ctrl+Shift+R).
Ctrl+P - Open a file by using the Command Menu. This is the same as going to the Sources tool and then clicking a file in the Workspace tab.
Close a file
To close a file, click the x button in the file's tab.
The file is closed in the Quick source tool and Sources tool.