Note
Access to this page requires authorization. You can try signing in or changing directories.
Access to this page requires authorization. You can try changing directories.
The article explains compute usage reporting of the SQL database in Microsoft Fabric.
When you use a Fabric capacity, your usage charges appear in the Azure portal under your subscription in Microsoft Cost Management. To understand your Fabric billing, see Understand your Azure bill on a Fabric capacity.
After February 1, 2025, compute and data storage for SQL database are charged to your Fabric capacity. Additionally, backup billing will start after April 1, 2025.
Capacity
In Fabric, based on the Capacity SKU purchased, you're entitled to a set of Capacity Units (CUs) that are shared across all Fabric workloads. For more information on licenses supported, see Microsoft Fabric concepts and licenses.
Capacity is a dedicated set of resources that is available at a given time to be used. Capacity defines the ability of a resource to perform an activity or to produce output. Different resources consume CUs at different times.
Capacity for SQL database in Microsoft Fabric
In the capacity-based SaaS model, SQL database aims to make the most of the purchased capacity and provide visibility into usage.
In simple terms, 1 Fabric capacity unit corresponds to 0.383 Database vCores, or, 1 Database vCore corresponds to 2.611 Fabric capacity unit.
For example, a Fabric capacity SKU F64 has 64 capacity units, which is equivalent to 24.512 SQL database vCores.
Compute and storage costs
The cost for SQL database in Fabric is the summation of compute cost and storage cost. Compute cost is based on vCore and memory used.
For example, a database with workload activity for two minutes and otherwise inactive for the remainder of the hour. The capacity is billed for compute for two minutes and kept online for another 15 minutes, totaling 17 minutes of compute billing. The database is kept online to preserve application response times and prevent performance delays when accessing an idle database.
Only storage is billed throughout the hour.
Autoscaling and minimum memory allocation
SQL database in Fabric autoscales compute and provisions a minimum of 2 GB memory, billed as compute while the database is online.
After 15 minutes of inactivity, all compute resources including CPU and memory are released, and the compute bill is zero.
Cache reclamation
SQL Server performs cache reclamation during low or idle periods to reduce memory usage and costs. However, 2 GB minimum memory is still required to keep SQL Server operational responsive while online.
Compute billing example
To compare CPU with memory for billing purposes, memory is normalized into units of vCores by rescaling the number of GB by 3 GB per vCore.
For example, the following sample bill in this example is calculated as follows:
| Time Interval (min) | vCores used each second | Memory GB used each second | Compute dimension billed | CU Seconds Billed (Simple Explanation) |
|---|---|---|---|---|
| 00:00–0:05 | 2 | 3 | vCores used | Used 2 vCores for 300 seconds. CPU was higher than memory, so billing is based on vCore usage. Calculation: 2 × 300 × 2.611 = 783 CU seconds. |
| 0:05–0:15 | 1 | 6 | Memory used | Used 6 GB memory for 600 seconds. Memory exceeded CPU, so billing is based on memory usage. Memory-to-vCore ratio: 6 GB = 2 vCores. Calculation: 2 × 600 × 2.611 = 3,133 CU seconds. |
| 0:15–0:30 | 0 | 2 | Minimum memory allocated | Minimum 2 GB memory is allocated to keep the database ready, even when idle. Memory-to-vCore ratio: 2 GB = 0.57 vCore. Calculation: 0.57 × 900 × 2.611 = 1,566 CU seconds. |
| 0:30–0:60 | 0 | 0 | No compute billed after 15 minutes of inactivity | No activity for 15 minutes, so all compute, including CPU and memory, is released. Compute billing stops. Calculation: 0 CU seconds. |
Total Estimated CU seconds: 5482 CU seconds
Storage billing example
Storage is billed continuously, even when compute is paused.
| Storage Type | Current Storage (GB) | Billable Storage (GB) | Billing Type | Example |
|---|---|---|---|---|
| Allocated SQL Storage | 80.53 GB | 2.84 GB | Billable | Storage used to persist SQL database data pages |
| SQL Database Backup Storage | 14.59 GB | 0.51 GB | Billable | Storage used for full recovery backup chain to ensure point-in-time recovery for the database |
Total billable storage in this example: 2.84 + 0.51 = 3.35 GB
Storage billing applies for the full hour, regardless of compute state.
Fabric Capacity SKU selection based on SQL database vCores
Reference this for Fabric SKU sizing estimations for SQL database in Fabric. For more information, see the Microsoft Fabric Capacity Estimator tool.
| SKU | Capacity Units (CU) | SQL database vCores per second |
|---|---|---|
| F2 | 2 | 0.766 |
| F4 | 4 | 1.532 |
| F8 | 8 | 3.064 |
| F16 | 16 | 6.128 |
| F32 | 32 | 12.256 |
| F64 | 64 | 24.512 |
| F128 | 128 | 49.024 |
| F256 | 256 | 98.048 |
| F512 | 512 | 196.096 |
| F1024 | 1024 | 392.192 |
| F2048 | 2048 | 784.384 |
Compute usage reporting
The Microsoft Fabric Capacity Metrics app provides visibility into capacity usage for all Fabric workloads in one place. Administrators can use the app to monitor capacity, the performance of workloads, and their usage compared to purchased capacity.
Initially, you must be a capacity admin to install the Microsoft Fabric Capacity Metrics app. Once installed, anyone in the organization can have permissions granted or shared to view the app. For more information, see What is the Microsoft Fabric Capacity Metrics app?
Once you have installed the app, select the SQLDbNative from the Select item kind: dropdown list. The Multi metric ribbon chart and the Items (14 days) data table now show only SQLDbNative activity.

SQL database operation categories
You can analyze universal compute capacity usage by workload category, across the tenant. Usage is tracked by total Capacity Unit Seconds (CUs). The table displayed shows aggregated usage across the last 14 days.
Fabric SQL database rolls up under SQLDbNative in the Metrics app. The operation categories seen in this view are:
- SQL Usage: Compute charge for all user-generated and system-generated T-SQL statements within a Database.
For example:
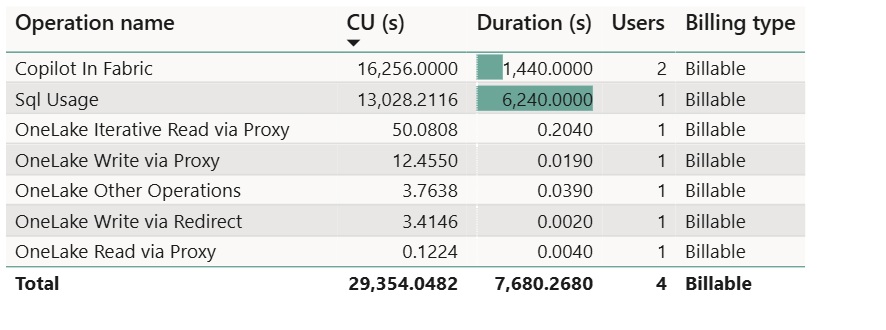
The billing type field is used to determine whether the workload is in preview mode or billable.
Timepoint explore graph
This graph in the Microsoft Fabric Capacity Metrics app shows utilization of resources compared to capacity purchased. 100% of utilization represents the full throughput of a capacity SKU and is shared by all Fabric workloads. This is represented by the yellow dotted line. Selecting a specific timepoint in the graph enables the Explore button, which opens a detailed drill through page.

In general, similar to Power BI, operations are classified either as interactive or background and denoted by color. Most operations in SQL database category are reported as interactive with 5 minute smoothing of activity.
Timepoint drill through graph

This table in the Microsoft Fabric Capacity Metrics app provides a detailed view of utilization at specific timepoints. The amount of capacity provided by the given SKU per 30-second period is shown along with the breakdown of interactive and background operations. The interactive operations table represents the list of operations that were executed at that timepoint, and are driven directly by user activity.
Top use cases for this view include:
Identification of SQL queries(statements) status: values can be Success or Rejected.
- The Success status is standard SQL database behavior when the capacity is not throttled.
- The Rejected status can occur because of resource limitations due to capacity throttling.
Identification of SQL queries(statements) that consumed many resources: sort the table by Total CU(s) descending by timestamp and artifact.
Considerations
Consider the following usage reporting nuances:
- Duration(s) field reported in Fabric Capacity Metrics App is for informational purposes only. It reflects the time window for current SQL usage corresponding to 60 seconds.
Storage usage reporting
Storage usage reporting helps admins to monitor storage consumption across their organization in capacity metrics. After selecting the capacity, adjust the date range to align with the storage emitted during a billing cycle. The experience slider helps you filter on the workload experience.
Possible storage Operation name values are:
- Allocated SQL storage is the total database size.
- SQL database Backup Storage is the backup storage usage that exceeds the allocated size and will be billed accordingly.

Current storage metrics align with a graph on the left to show average storage at a daily grain or an hourly grain if you drill in.
Storage utilization reporting occurs at the workspace level. If you want more information about storage usage inside the database, see Performance Dashboard for SQL database in Microsoft Fabric.
Backup storage billing
SQL database in Microsoft Fabric provides automatic backups from the moment a database is created. Backup billing is determined by the amount of storage consumed by the automated backup process.
- By default, backup storage is free up to 100% of your provisioned database size. For example, a database with 100 GB of allocated storage automatically includes 100 GB of backup storage at no additional cost.
- If backup storage usage exceeds the allocated database size, additional charges apply. You're billed only for the backup storage that exceeds the allocated size.
Backup storage usage is measured hourly and calculated as a cumulative total. At the end of each month, this value is aggregated and used to calculate your bill. Charges are based on the total GB/month.
For example, if a database accumulates 100 GB of allocated data storage and backup storage accumulates 150 GB of backup storage and stays constant for a month, you would be charged for 100 GB of data storage and additional 50 GB of the backup storage at the applicable rate.